STRATEGY AND BUSINESS OPERATIONS
Project Juniper
Playing the role of a BizOps Manager, I pitched a data-driven solution to the COO of Juniper, an on-demand delivery platform.
Under the mentorship of leaders from Revolut and DoorDash, my team of fellow Skillful learners and I were able to draw key insights and recommendations that assessed the success of a new geographic market launch and also crafted experiments to improve the business.
Role: Business Operations Manager
Timeline: 6 weeks
Tools & Skills: SQL, Redash, Google BigQuery, Microsoft Excel, GSuite
Setting the stage
Juniper is an on-demand delivery platform that connects couriers, customers, and merchants. Customers can purchase a variety of goods, but mostly food. Couriers purchase and pickup requested items from any merchant on the Juniper app. Their mission is to enable anyone to have anything delievered on-demand. Last month, the platform launched in a new geographic market: New York.
The Ask: The COO is wondering how the launch went and what can be done to improve the business going forward
The Approach:
- Issue Tree Framework
- Data Analysis
- Priortization
- Presentation
STEP ONE
Defining the problem
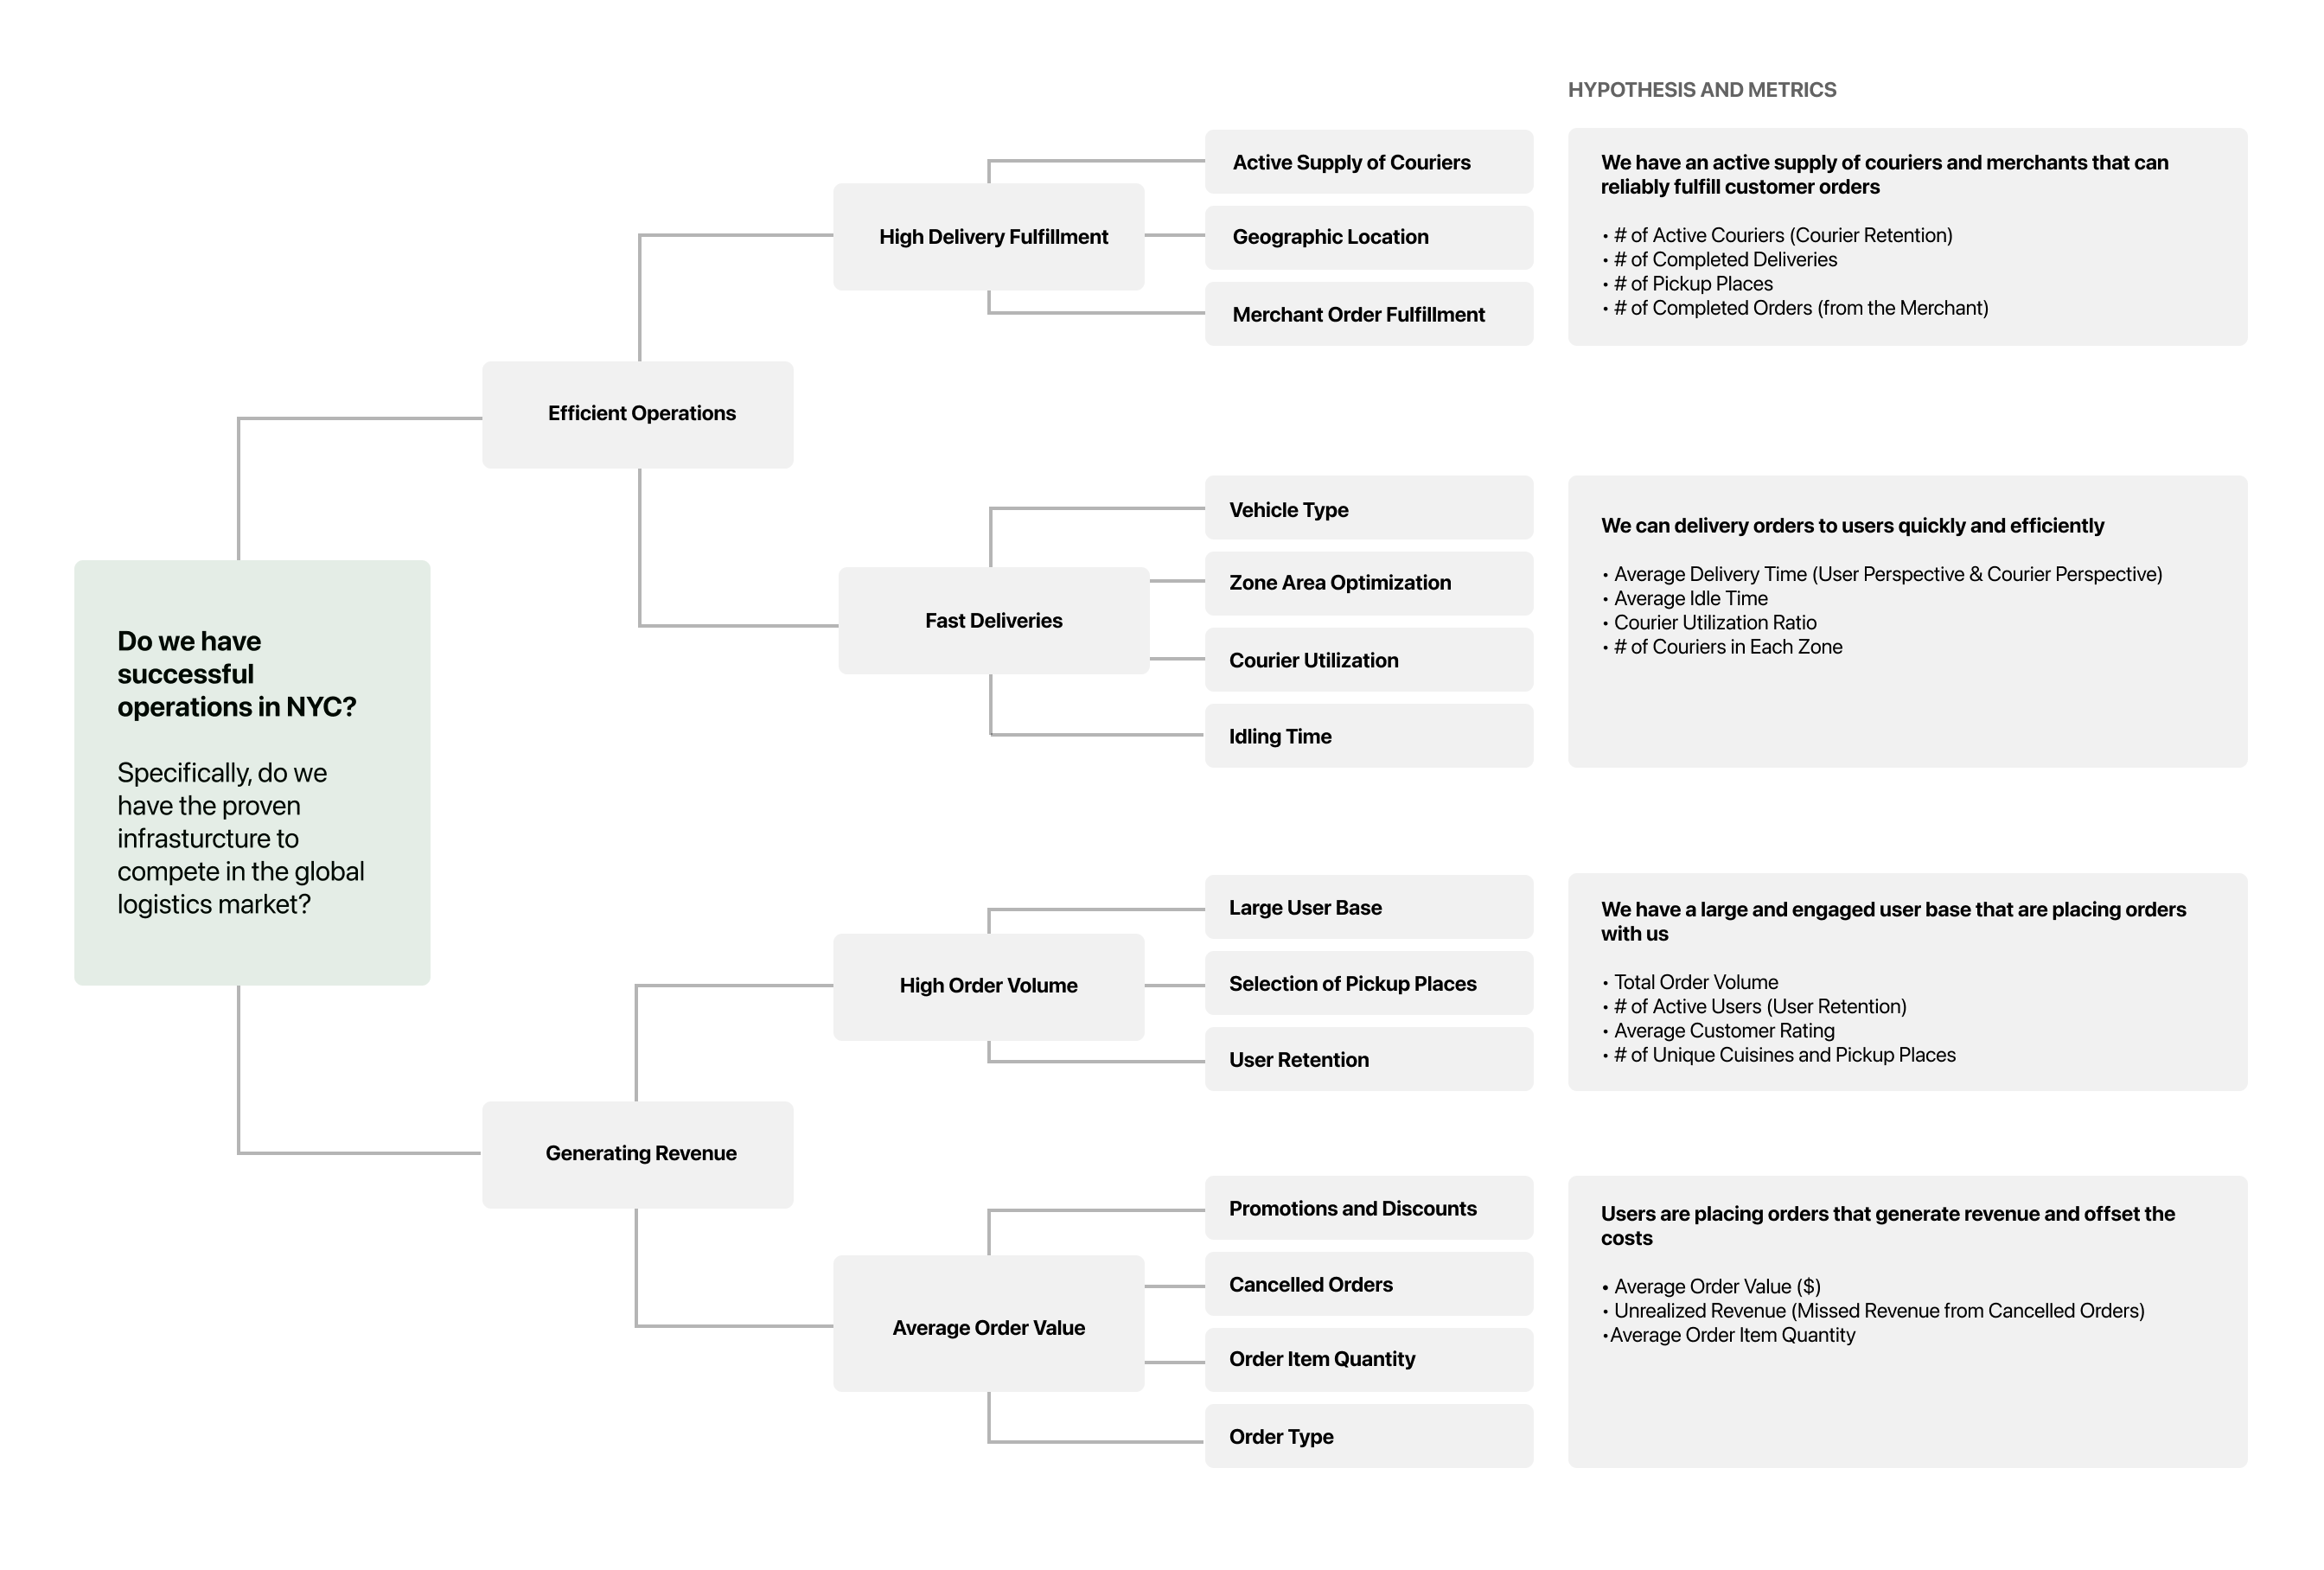
We first created an issue tree to breakdown our problem into specific compontents that can be addressed discreetly. This framework ensured that we were going to answer the right questions and focus on the most relevant areas for our key stakeholder.
Knowing that our stakeholder was the COO who visioned Juniper to own the global logistics market, we defined success as having an operations infrastructure that could compete in the global logistics market.
OUR ISSUE TREE
STEP TWO
Diving into the data
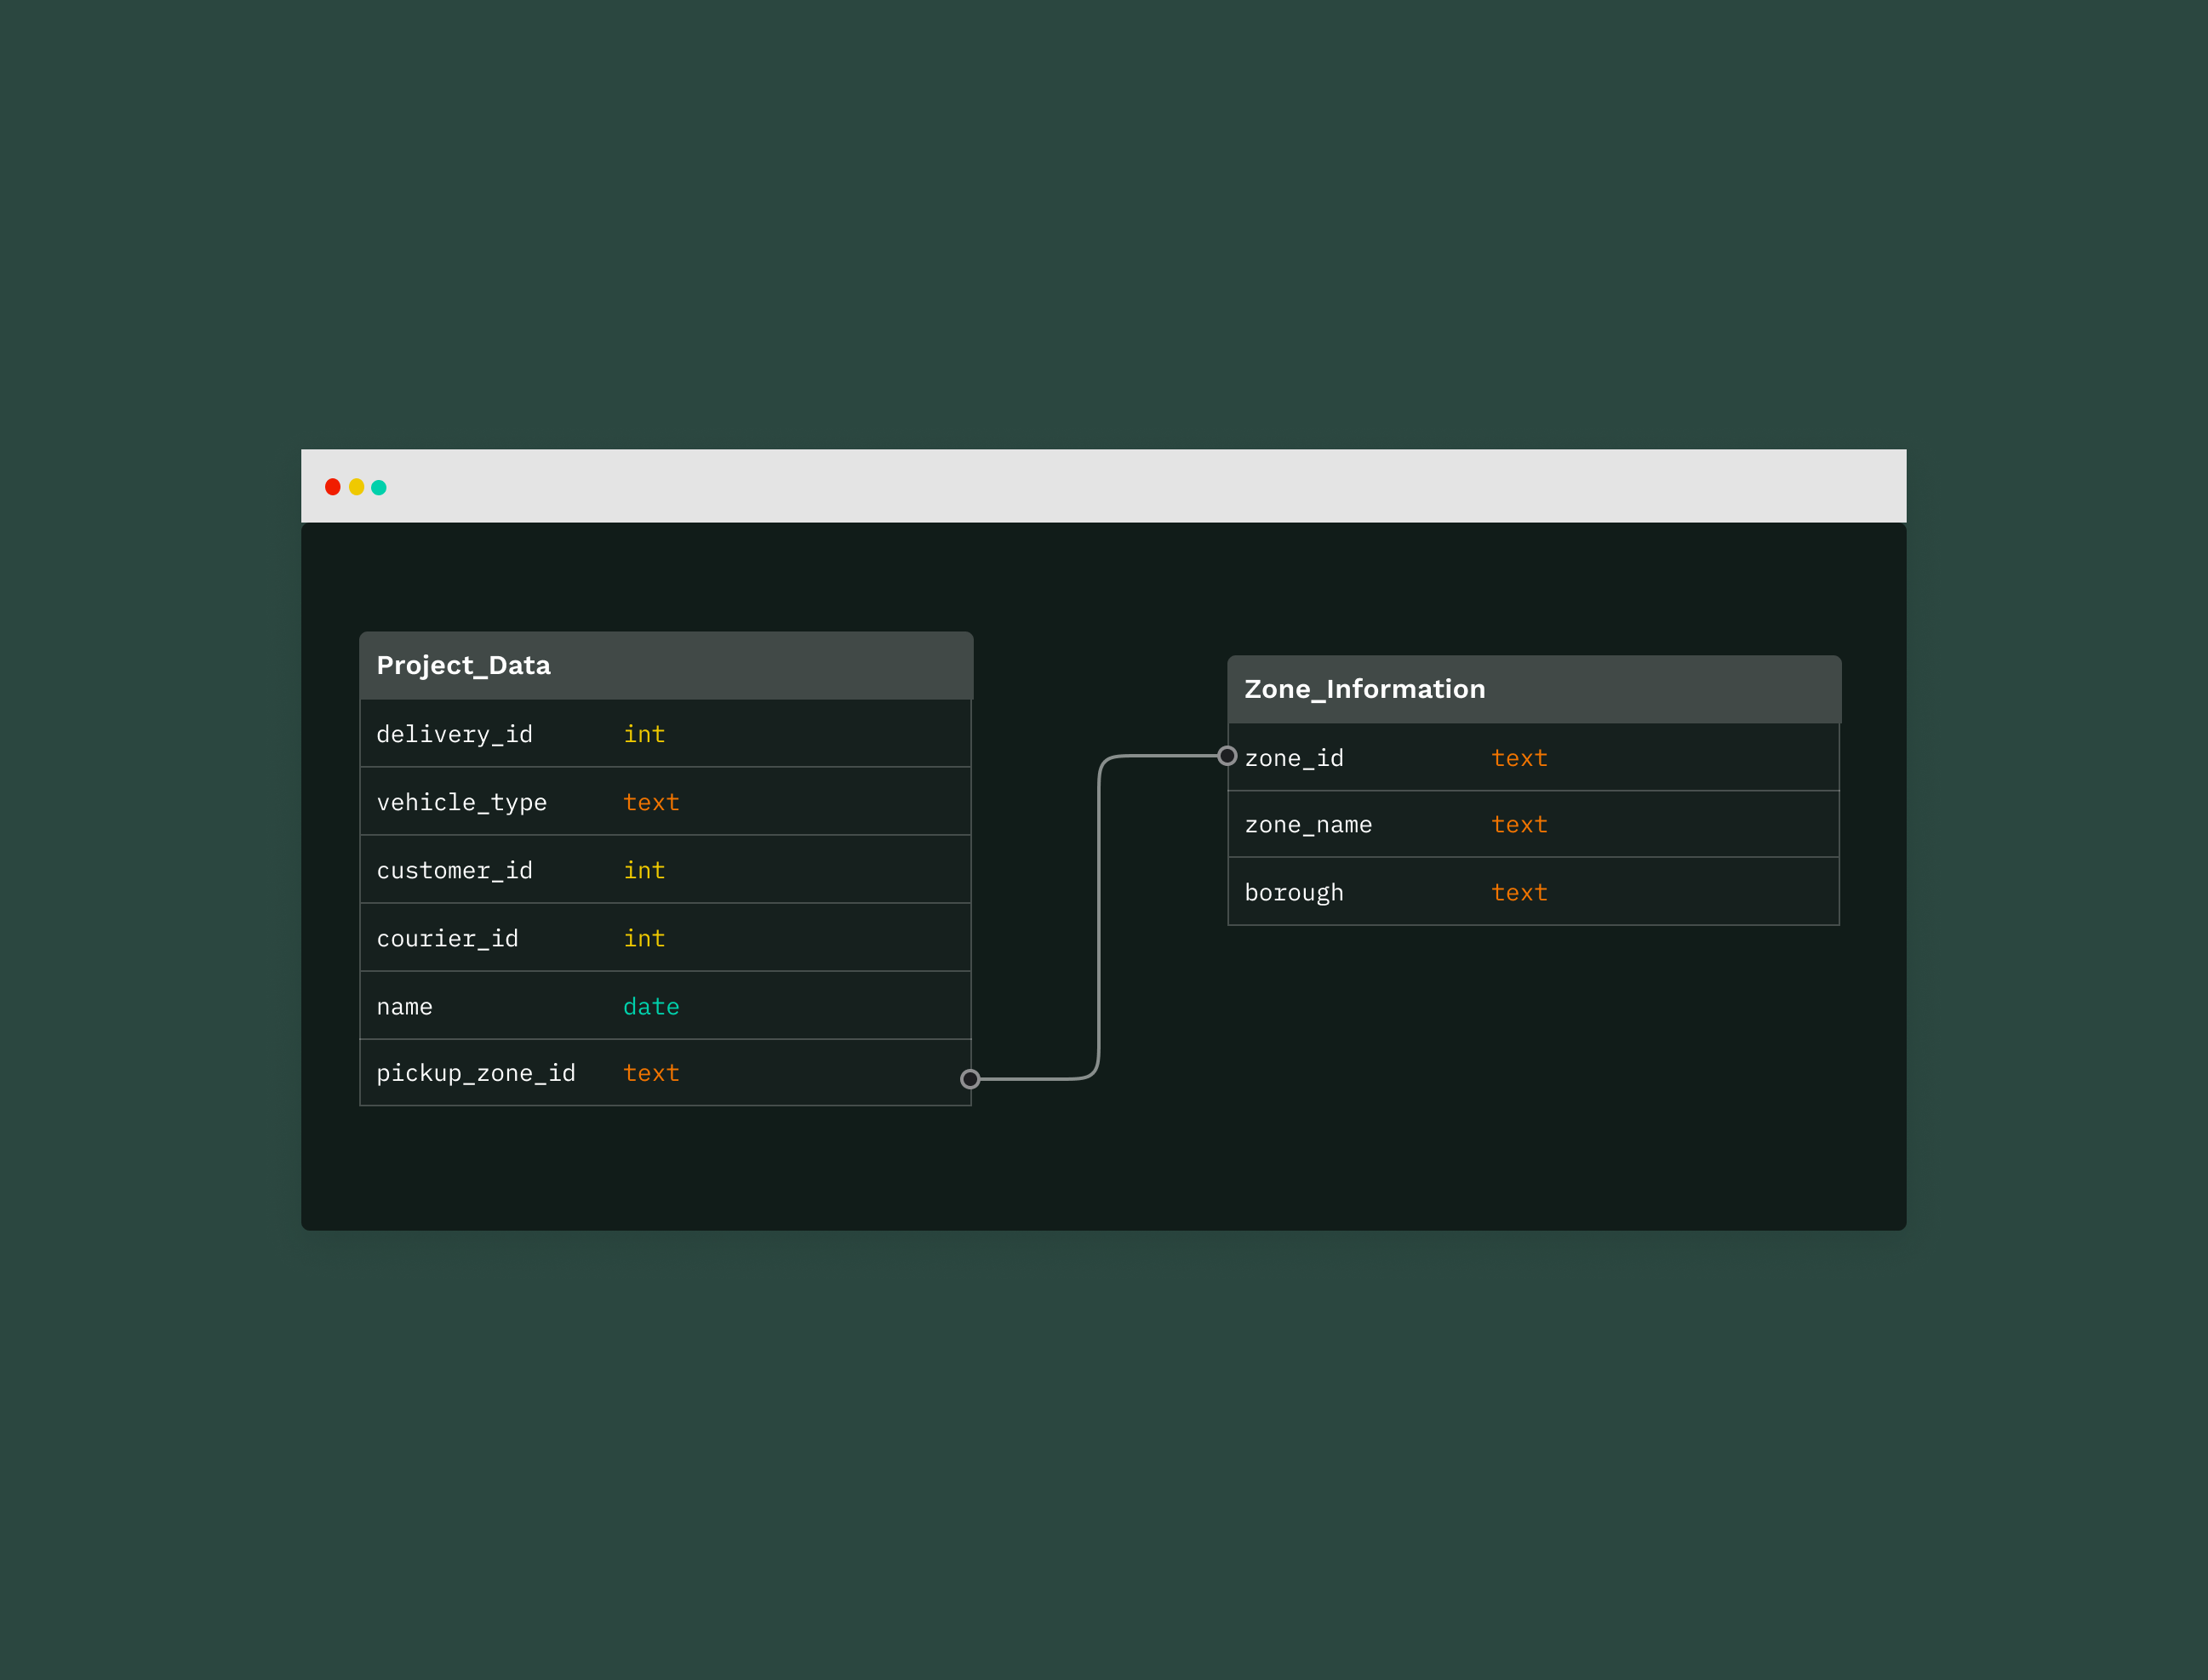
We sought to answer our questions using data, specifically one month's worth of delivery data from the New York launch. This large and ambigious dataset included fields like the courier ID for each delivery and the timestamp for when the restaurant accepted the order.
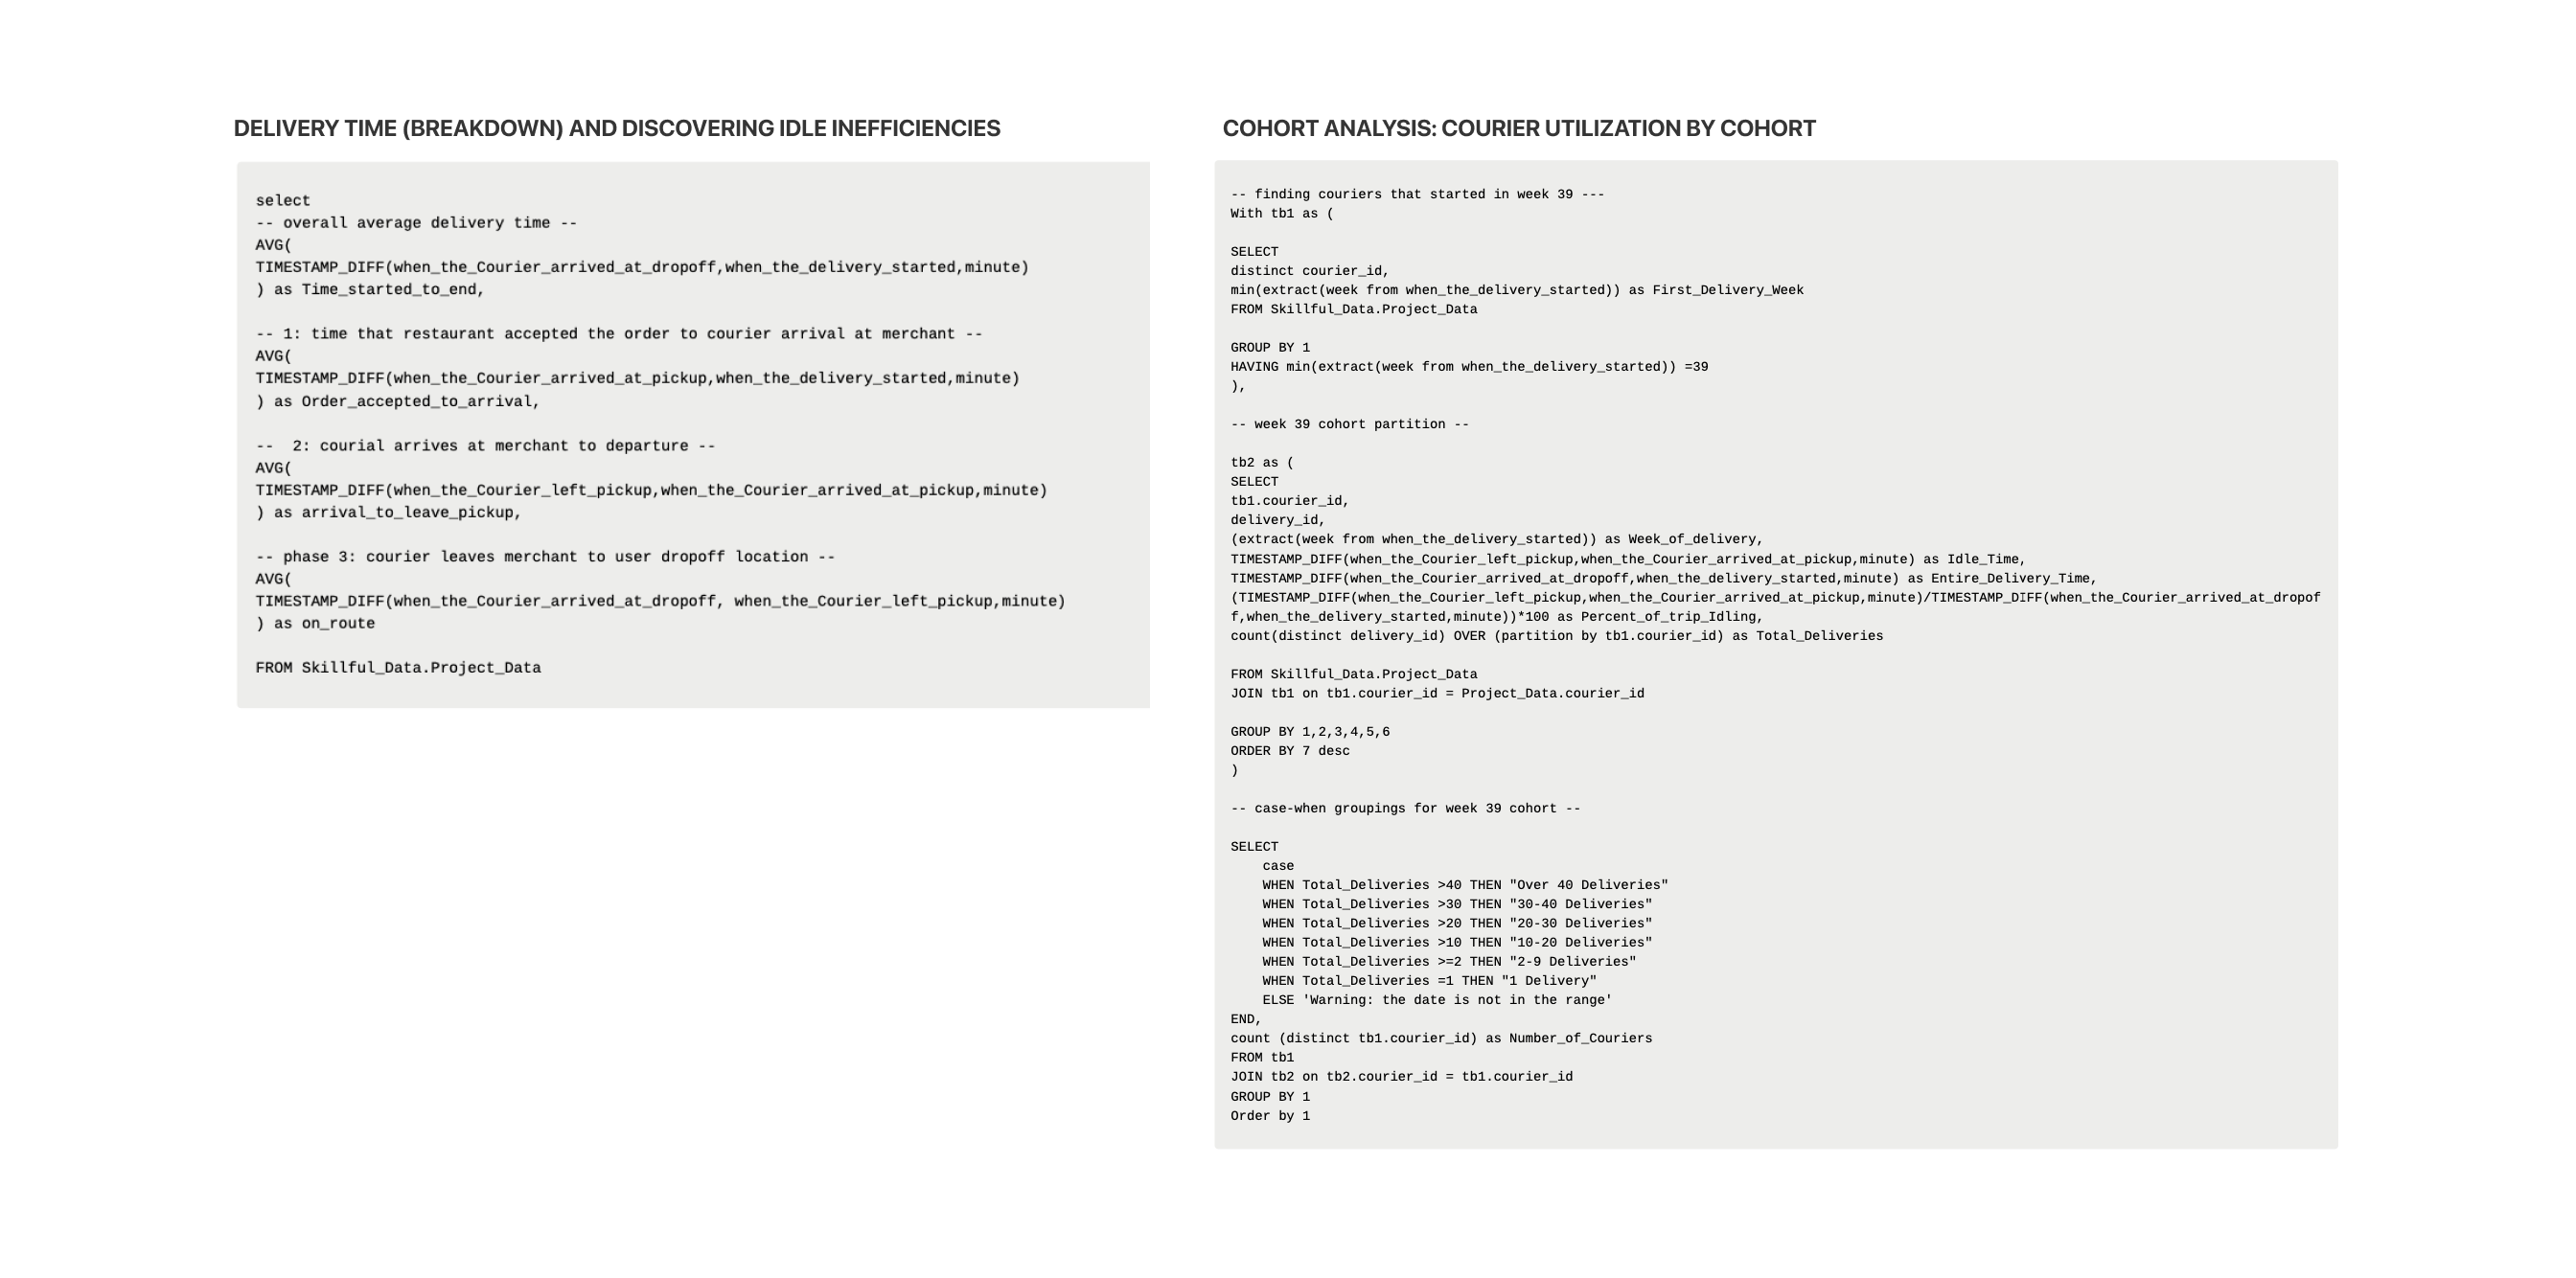
By leveraging data analysis and visualization tools like SQL and Tableau, I was able to uncover key insights and focus areas within our operations like addressing delivery time inefficiencies.
SAMPLE OF QUERIES USED TO PULL INSIGHTS FROM DATASET
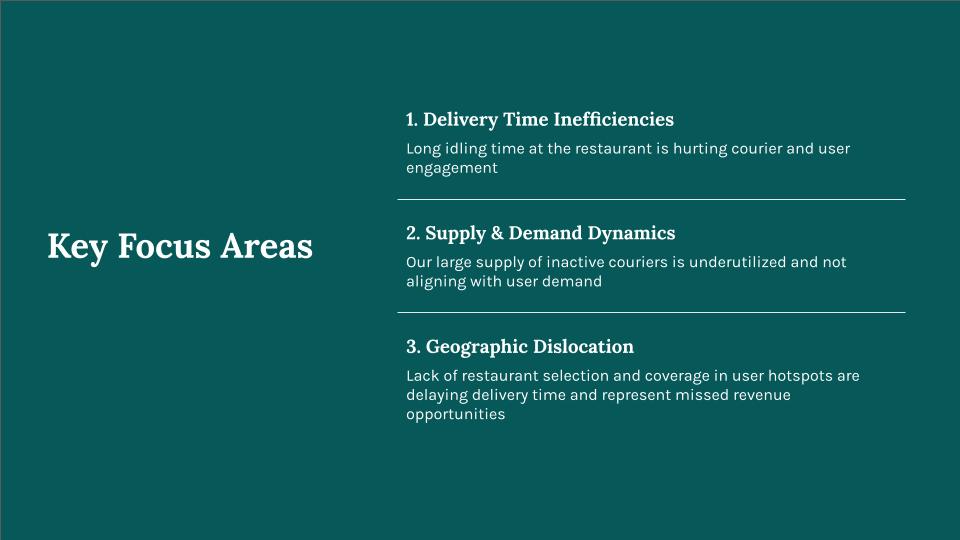
EXCERPT FROM PRESENTATION: KEY FOCUS AREAS
STEP THREE
Prioritization
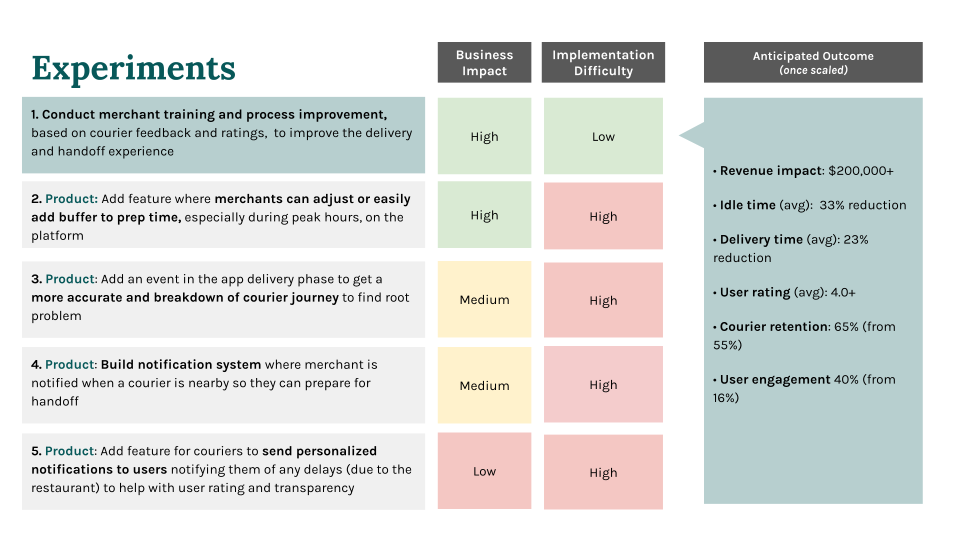
From our analysis, we designed experiments to test our recommendations and how we would scale if successful. We identified several ways to tackle our problem areas so with practicalities in mind (like needed resources and stakeholder buy-in), we prioritized based on the potential business impact and implementation difficulty.
EXCERPT FROM PRESENTATION: EXPERIMENT SUMMARY
STEP FOUR
Presenting our recommendations
We synthesized our findings into one cohesive narrative, keeping our stakeholder front and center when developing our story, and pitched our recommendations.

Key learnings
This was a great project for me to put my SQL learning into action and I was recognized for my data analysis with an individual superlative, nominated by my mentors and peers. I will continue to hone in my data analytical skills to pull key insights and leveraging that to drive better recommendations.
I also learned some important takeaways from this project that I will carry forward with me:
- Use a hypothesis-driven approach to solving an ambiguous problem. When provided with large datasets, it can be tempting to go down a rabbit hole without drawing any meaningful conclusions. The issue tree that we created at the start of the project ensured that we were answering the right questions, focusing our efforts on the most relevant areas, and quickly moving our project along.
- Data is used to make decisions for high-growth businesses. For operationally-intensive businesses such as Juniper, data collected from daily operations is used to guide every decision - from daily priortization to cross-functional strategic initiatives.
I completed this six-week project through Skillful. Skillful is a skills-based mentorship program that teaches the skills and industry fundamentals used by strategy and operations teams at high-growth tech companies. I was coached by mentors who work at companies like Uber, Instacart, DoorDash. If you have any questions about the program, please reach out to me or learn more here: https://www.joinskillful.com/
Naomi Chun -
Creating data-driven and thoughtful experiences for the user and business